Pension Freezes Continue Among Fortune 1000 Companies in 2009
From 2008 to 2009, the number of Fortune 1000 firms sponsoring a frozen defined benefit (DB) pension plan increased by 4 percent. The freeze rate has remained relatively constant over the last two years, as plan sponsors continue to seek ways to lower expenses, especially in the current economic downturn.
Employers have been rethinking their retirement plan configurations for some time now, and, over the last 10 years, many of them have shifted from DB plans to defined contribution (DC) plans. The shift has been driven by a variety of motives, including overcoming financial difficulties, aligning retirement packages to stay competitive in a global market, reducing expenses and shifting risk. These issues have taken on even greater urgency in the recent financial crisis.
The shift to DC plans transfers retirement responsibility and risk from employers to employees, who must now manage their own contributions, accumulations and retirement income.
Watson Wyatt has been collecting data on DB sponsors in the Fortune 1000 for several years, with a particular focus on firms that have frozen their plans. In a pension freeze, the company typically retains its DB plan but stops future accruals for all or some workers. Freezes can take various forms. Traditional pensions whose formula relates to pay and years of service can halt the years-of-service component of the formula, freeze the pay portion to disregard future salary increases or both. In a hybrid or other account-based pension plan, companies typically stop making pay credits or contributions to the accounts, but balances continue to accrue with interest. In a closed DB plan, current employees continue to earn pension benefits, but employees hired after some fixed date cannot participate in the plan.
Many large companies sponsor more than one pension plan. Some have separate plans for their unionized and salaried workforces, and some have multiple plans due to mergers and acquisitions. So a sponsor of a frozen plan might still maintain an active DB plan, which is indeed the case for some firms in this analysis.
DB sponsorship and freezes among the Fortune 1000
Firms are
classified as DB sponsors if they still manage DB plan assets, even if the
plan is frozen. The rate of DB sponsorship in the Fortune 1000 decreased
from 63 percent in 2004 to 61 percent in 2009. Turnover in the Fortune
list explains most of the decline. Of the 74 companies that joined this
year’s list, 45 sponsor only a DC plan. Twenty-nine of these companies
maintain a DB plan (eight are frozen). Of the 74 companies dropped from
this years’ list, 32 provide only a DC plan, while 42 maintain a DB plan
(17 are frozen).
The percentage of companies in the Fortune 1000 sponsoring an active pension has decreased significantly over the last six years. In 2004, 59 percent of companies in the Fortune 1000 maintained a DB plan that was not frozen compared with 42 percent in 2009. Over these six years, the number of Fortune 1000 firms that sponsor one or more frozen plans has more than quadrupled — from 45 in 2004 to 190 in 2009 (as shown in Figure 1).
Figure 1
DB sponsorship among the Fortune 1000,
2004-2009
|
Fortune 1000 list year |
Number of DB plan sponsors |
Sponsors of actively accruing DB plans |
Sponsors of frozen DB plans |
|
2009 |
607 |
417 |
190 |
|
2008 |
624 |
455 |
169 |
|
2007 |
638 |
500 |
138 |
|
2006 |
627 |
514 |
113 |
|
2005 |
627 |
556 |
71 |
|
2004 |
633 |
588 |
45 |
Source: Watson Wyatt.
Figure 2 shows the percentage of Fortune 1000 DB sponsors that have frozen one or more of their pension plans. In 2004, only 7 percent of DB sponsors had a frozen pension. In 2009, 31 percent of DB sponsors maintain a frozen pension plan.
Figure 2
Percentage of DB plan sponsors with frozen pension
plans, 2004-2009
|
Fortune 1000 list year |
Number of DB sponsors |
Percentage of DB plan sponsors with frozen plans |
|
2009 |
607 |
31.3% |
|
2008 |
624 |
27.1% |
|
2007 |
638 |
21.6% |
|
2006 |
627 |
18.0% |
|
2005 |
627 |
11.3% |
|
2004 |
633 |
7.1% |
Source: Watson Wyatt.
Timing of freezes and the composition effect of the 2009 Fortune
1000
Pension freezes for Fortune 1000 companies began accelerating
in 2003. Figure 3 shows the distribution of pension freezes from
1988 to 2013 (including planned freezes) for the 2009 Fortune 1000. Of
participants in this year’s Fortune 1000 list that froze a DB plan, 31 did
so in 2006, 30 in 2007 and 25 in 2008. So far, there have been 18 freezes
in 2009.1
Figure 3
Distribution of pension freezes, 1988-2013*
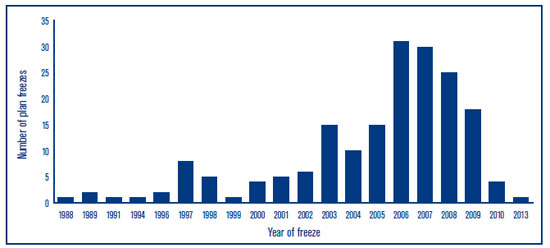
*Projected.
Source: Watson Wyatt.
We next examine companies that have been in the Fortune 1000 since we began our study six years ago (see Figure 4). This analysis is one way to highlight the effects of turnover in the Fortune 1000 on our results.
Figure 4
Current DB sponsorship for firms in the Fortune 1000
since 2004
|
Companies in Fortune 1000 since 2004 |
Number of DB plan sponsors |
Cumulative number of sponsors with one or more frozen plans |
DB sponsors with active plans |
% of companies with active plan |
% of DB plan sponsors with frozen plan |
|
719 |
475 |
138 |
337 |
46.9% |
29.1% |
Source: Watson Wyatt.
Results for the six-year Fortune 1000 group are slightly different from those for the current Fortune 1000 members (see Figure 5). The rate of DB sponsorship is higher among the six-year group than among the current list (66 percent vs. 61 percent), and the percentage of freezes among the six-year group is somewhat lower (29 percent vs. 31 percent). These differences could arise from the group makeup — companies that have managed to remain in the Fortune 1000 for six years are less likely to be struggling financially than those who fell off the list. This year’s turnover seems to support this explanation, as many more companies with frozen pensions dropped off than joined the list. For the six-year group, freezes peaked in 2007. For firms in the 2009 list, freezes peaked in 2006.
Figure 5
Number of DB plan freezes for six-year Fortune 1000
group by year, 1988-2010
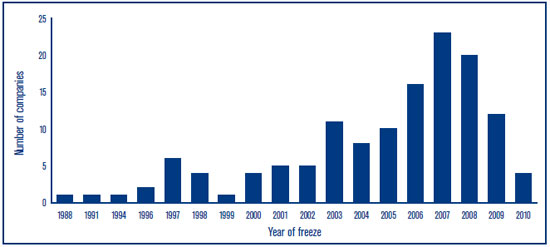
Source: Watson Wyatt.
For the companies in our six-year Fortune 1000 group, we next look at three retirement expense accounting measures (where full financial data were available for comparison). Figure 6 shows service cost (actuarial present value of pension benefits accrued during the year), net pension expense and DC expense (typically matching and nonmatching employer contributions) for fiscal years 2003 and 2008. These values are calculated on an aggregate and average basis for three categories of companies: those with pensions still actively accruing benefits, those that froze one or more of their pensions during this period and those that froze pensions before 2004.
Figure 6
Service cost, net pension expense and DC expense for
six-year group ($ thousands)
2003 |
2008 | ||||||
n |
Aggregate service cost |
Aggregate net pension expense |
Aggregate DC expense |
Aggregate service cost |
Aggregate net pension expense |
Aggregate DC expense | |
All companies |
365 |
$19,232,987 |
$19,999,037 |
$12,852,928 |
$21,249,980 |
$14,004,955 |
$19,520,569 |
Active DB |
259 |
$14,642,305 |
$13,813,936 |
$8,799,277 |
$18,933,999 |
$13,619,236 |
$12,141,203 |
Active DB to frozen DB from 2004 to 2009 |
83 |
$4,499,104 |
$6,005,997 |
$3,699,223 |
$2,197,270 |
$300,614 |
$6,969,478 |
Frozen DB throughout |
23 |
$91,578 |
$179,104 |
$354,428 |
$118,711 |
$85,105 |
$409,888 |
2003 |
2008 | ||||||
n |
Average service cost |
Average net pension expense |
Average DC expense |
Average service cost |
Average net pension expense |
Average DC expense | |
All companies |
365 |
$52,838 |
$54,792 |
$35,214 |
$58,540 |
$38,370 |
$53,481 |
Active DB |
259 |
$56,534 |
$53,336 |
$33,974 |
$73,104 |
$52,584 |
$46,877 |
Active DB to frozen DB from 2004 to 2009 |
83 |
$54,867 |
$72,361 |
$44,569 |
$26,796 |
$3,622 |
$83,970 |
Frozen DB throughout |
23 |
$3,982 |
$7,787 |
$15,410 |
$5,396 |
$3,700 |
$17,821 |
Source: Watson Wyatt.
For all companies in this analysis, from fiscal 2003 to 2008, service cost for pensions increased by roughly 10 percent, while DC expense increased by 52 percent. The growth in service cost overall is attributable to companies with active pensions still accruing benefits. Service costs increased due to salary increases, declines in the interest rates used to calculate the service cost component and other factors.2 For companies maintaining active pensions, service cost increased by roughly 29 percent over this period. While DC expense rose for all companies, the increase was 88 percent for companies that froze a pension plan vs. 38 percent for those with active DB plans. This is not surprising, because many companies that freeze a DB plan enhance their matching or nonmatching contribution to their DC plan3 and adopt other plan features to encourage participation, hence increasing employer contributions to these savings plans.
Companies that froze their pension plans significantly reduced net pension expense. At year-end 2008, these companies averaged roughly $3.6 million in pension expense compared with $72 million in fiscal 2003. Sponsors of active plans reported average pension expense of $52.5 million for fiscal 2008.
Overall dollar expenses for all retirement plans increased somewhat from fiscal 2003 through fiscal 2008, but the composition changed significantly over that period. In 2003, net pension expense represented the majority of retirement expense, while in 2008, DC expense predominated.
From 2003 to 2008, total retirement expense (total pension expense + total DC expense) declined by 25 percent in companies that froze a pension plan and increased by 14 percent in companies that still maintain active pensions.
We next look at the same six-year group of companies to see whether different types of plan sponsors employ different asset allocation strategies for their pension plans, either active or frozen.
Figure 7 looks at target asset allocation strategies for these companies where data are provided for both 2003 and 2008.4
Figure 7
Target asset allocation for six-year group
2004 | ||||||
n |
Cash |
Equity |
Debt |
Real estate |
Other | |
All companies |
288 |
0.48% |
64.12% |
31.34% |
2.01% |
2.59% |
Active DB |
207 |
0.55% |
64.69% |
30.97% |
1.94% |
2.51% |
Active DB to frozen DB from 2004 to 2009 |
68 |
0.37% |
62.65% |
32.17% |
2.26% |
2.62% |
Frozen DB throughout |
13 |
0.00% |
62.42% |
32.46% |
2.15% |
4.08% |
2009 | ||||||
n |
Cash |
Equity |
Debt |
Real estate |
Other | |
All companies |
288 |
0.61% |
58.92% |
33.66% |
2.19% |
4.92% |
Active DB |
207 |
0.51% |
59.52% |
32.95% |
2.28% |
5.19% |
Active DB to frozen DB from 2004 to 2009 |
68 |
0.74% |
56.88% |
36.24% |
1.91% |
3.99% |
Frozen DB throughout |
13 |
0.73% |
58.81% |
32.31% |
2.62% |
6.15% |
Source: Watson Wyatt.
While asset allocations to equities have declined across all groups, and debt and “other” have increased slightly, we see no large reduction in equities for companies with a frozen pension plan. Of the 68 companies that froze a pension over this period, only 18 percent shifted their target allocations to reduce equities by more than 15 percentage points.
Industry analysis
It used to be that most companies that
froze their DB plan were in financial distress. The airline and steel
industries were in particularly dire straits, and sponsors in these
industries hoped that freezing their pension plans would ease their
financial difficulties. While pension freezes have since spread to all
sectors, some industries experience higher freeze rates than others (see
Figure 8).
Industries with higher DB sponsorship rates are less likely to freeze a plan than those with lower sponsorship rates. The utilities industry is a good example. It has high rates of DB sponsorship and very few plan freezes. Firms in these industries typically employ large unionized workforces and might want to keep their plans for both union and nonunion workers comparable.
The automobile and financial services industries are two exceptions. Their high freeze rates relative to their DB sponsorship rates are surely due to financial distress. Companies in these sectors have been operating under drastic cash-flow constraints, and many have received large infusions of financial support from the government to keep going.
Figure 8
DB sponsorship in the 2009 Fortune 1000 by industry
|
|
|
|
|
|
Percentage of firms with DB plan |
Percentage of firms with active DB plan |
Percentage of firms with frozen DB plan |
Aerospace and defense |
7 |
7 |
6 |
1 |
100.0% |
85.7% |
14.3% |
Utilities |
60 |
57 |
54 |
3 |
95.0% |
94.7% |
5.3% |
Food and beverage |
31 |
29 |
25 |
4 |
93.5% |
86.2% |
13.8% |
Automobiles and transportation equipment |
24 |
21 |
14 |
7 |
87.5% |
66.7% |
33.3% |
Manufacturing |
166 |
141 |
101 |
40 |
84.3% |
71.6% |
28.4% |
Natural resources |
72 |
50 |
36 |
14 |
69.4% |
72.0% |
28.0% |
Energy |
35 |
23 |
17 |
6 |
65.7% |
73.9% |
26.1% |
Financial services, excl. insurance |
63 |
41 |
21 |
20 |
65.1% |
51.2% |
48.8% |
Financial services, incl. insurance |
59 |
38 |
31 |
7 |
64.4% |
81.6% |
18.4% |
Wholesale |
38 |
24 |
12 |
12 |
63.2% |
50.0% |
50.0% |
Communications |
50 |
30 |
17 |
13 |
60.0% |
56.7% |
43.3% |
Transportation |
34 |
20 |
12 |
8 |
58.8% |
60.0% |
40.0% |
Health care, incl. pharmaceuticals |
21 |
11 |
9 |
2 |
52.4% |
81.8% |
18.2% |
Professional and business services |
62 |
26 |
15 |
11 |
41.9% |
57.7% |
42.3% |
High-Tech |
80 |
31 |
14 |
17 |
38.8% |
45.2% |
54.8% |
Retail |
111 |
36 |
19 |
17 |
32.4% |
52.8% |
47.2% |
Health care, excl. pharmaceuticals |
46 |
14 |
11 |
3 |
30.4% |
78.6% |
21.4% |
Property and construction |
24 |
5 |
3 |
2 |
20.8% |
60.0% |
40.0% |
Tourism and leisure |
15 |
3 |
0 |
3 |
20.0% |
0.0% |
100.0% |
Education |
2 |
0 |
0 |
0 |
0.0% |
n/a |
n/a |
Source: Watson Wyatt.
Over the last year, there has been a significant increase in the percentage of companies with frozen plans in certain sectors.
For example, the percentage of DB sponsors in the retail sector maintaining a frozen pension plan climbed from 36 percent in last year’s analysis5 to 47 percent in this year’s analysis. The increase has most likely been driven by market competition — most retail companies do not sponsor DB plans. DB plan sponsors could be more likely to align their retirement packages with their competitors, and retail companies might believe a portable retirement package is best for their workforce.
The communications sector also experienced a significant increase in pension freezes over the year. Only 30 percent of these DB sponsors had a frozen DB plan last year, but the number rose to 43 percent in 2009. The communications industry includes newspaper and publishing companies, which are currently fighting to survive. To reduce costs, many of these companies also suspended matches to their DC plans over the last year.
The food and beverage sector had one of the largest percentage-point increases in pension freezes. Between the 2008 and 2009 analyses, the percentage of plan sponsors in this sector with a frozen DB plan jumped from 3 percent to 14 percent — an 11-percentage point increase. Despite this large rise, a small percentage of these DB sponsors have frozen pensions relative to other industries.
Closing plans to new hires
Over the last five years, Watson
Wyatt has also tracked Fortune 1000 firms that close a DB plan to new
hires. If a company closed a plan but also froze another plan or closed
its DB plan at an earlier date, it is counted as having implemented a
pension freeze for this analysis. In 2005, 25 companies closed at least
one DB plan to new hires. By 2009, this number had risen to 75.
Thirty-four percent of Fortune 1000 companies maintain an active DB plan
(neither frozen nor closed to new hires). Of DB plan sponsors, 44 percent
now have at least one plan that is either frozen or closed to new hires —
up from 40 percent last year.
Conclusion
The march of pension freezes has continued at a
steady pace over the last year. Only 42 percent of Fortune 1000 companies
still maintain a DB plan in which participants continue to accrue
retirement benefits. Instead, many companies are opting to provide DC
plans as the sole vehicle for accumulating retirement income. Recent
sizable market declines have left many workers approaching retirement —
especially those with only a DC plan — financially unprepared to retire.
In a recent Watson Wyatt survey of workers,6 44 percent of
respondents aged 50 and older said they must delay their retirement.
Three-quarters (76 percent) of responding workers aged 50 to 64 cited
their 401(k) account losses as the principal reason for the
postponement.
To reduce operating expenses, many plan sponsors are paring down retirement costs, either by closing/freezing pensions or reducing/suspending their matching contributions to their DC plans.7 Suspending or reducing the 401(k) match diminishes the incentive for employees to contribute to their retirement accounts. As a result, many employees might not defer enough money to retire in a timely and efficient manner.
Even given this continuation of pension freezes, however, industries with high rates of DB plan sponsorship have lower rates of pension freezing (except for the troubled auto and finance industries). While freezing a DB plan may create some accounting gain (by halting benefit accruals and recognizing curtailment gains, thereby decreasing plan liabilities and significantly reducing pension expense), it does not bring cash flow relief for many years, due to the liabilities of pensions already earned. Moreover, freezing a DB plan does not increase firm value. According to a recent study analyzing the market effects of freezing or closing a pension,8 the impact on stock prices was generally insignificant or negative when the adverse event was announced.
Many employers no longer find traditional pension plans to be optimal.9 With the legislative and regulatory barriers to hybrid designs such as cash balance plans well on the way to satisfactory resolution, DB plan sponsors could find hybrid plans more attractive in the near future. Hybrid plans — such as cash balance plans — reduce cost volatility for employers while providing reliable and portable benefits to employees. In hybrid plans, the employer still bears the financial risk, unlike DC plans, in which all financial risk is the worker’s responsibility. While many DC plan participants have realized major losses during the financial crisis, cash balance plan accounts have continued to grow.
While some employers might switch to hybrid plans, there are steps all employers can take to improve the operation of their retirement programs and better manage risk — whether on the DB or DC side. The retirement plan decisions employers make over the next few years will be critical to the viability of the country’s voluntary retirement system and will have an economic impact on employers regardless of who bears the direct financial risk in the benefit design.
1 If a plan will be frozen as of Dec. 31, we consider the
freeze to occur the following year (e.g., if a sponsor freezes a plan on
Dec. 31, 2008, participants have already accrued their 2008 benefits, so
we consider 2009 the year of the freeze).
2 Decreases in
discount rates increase service cost. End-of-year 2002 discount rates
averaged 6.7 percent, compared with 6.2 percent for end-of-year
2007.
3 See Watson Wyatt’s “Retirement Plan Design:
Past, Present and Future” (January 2008), www.watsonwyatt.com/research/resrender.asp?id=2007-US-0308&page=1.
4
Target asset allocation data from 2003 reflect the target strategy for the
next plan year (i.e., 2004). Some companies used a single value for their
target allocation, while others used a range. For purposes of this
analysis, if the target allocation was a range, a simple average was used,
so total target allocations do not necessarily equal 100
percent.
5 See “Pension Freezes Continue Among the
Fortune 1000, Albeit at a Slower Pace,” Watson Wyatt Insider, September
2008.
6 See “Effect of the Economic Crisis on Employee
Attitudes Toward Retirement, Part II: Retirement Timing,” Watson Wyatt,
June 2009.
7 See “Economic Crisis Prompts Many Companies
to Suspend Contributions to Employee Savings Plans,” Watson Wyatt Insider,
May 2009.
8 See Brendan McFarland, Gaobo Pang and Mark
J. Warshawsky, “Does Freezing a Defined Benefit Plan Increase Firm Value?”
Financial Analyst Journal (July/August 2009).
9 See
Watson Wyatt press release “Majority of Fortune 100 Companies Offer Only
Defined Contribution Plans to New Salaried Employees, Watson Wyatt
Analysis Finds,” May 2009.